In the past weeks, the World Bank released new Enterprise Survey Data for 2018. This new data follows the same format as the previous version with additional questions focusing on mobile money. While a previous version of this article was done with 2013 data, I believe updating it to best reflect current situation is necessary. What follows is in a similar vein to my previous paper on the topic. If you read the previous paper, feel free to skip to the updated figures and subsequent analysis.
According to the World Bank, Kenya is classified as a lower-middle-income economy with a gross national income of $1,460 (USD). As such, it is ideally situated to leverage the work of nonprofits to bring about positive economic growth. Unfortunately, nonprofits often lack the financial and personnel resources to determine analytically where those resources are best allocated. This article aims to alleviate that problem for nonprofits in Kenya by developing a general framework of the binding constraints affecting Kenyan businesses. Practical examples of binding constraints that may be present in Kenya include the manufacturing sector where the resources for expansion may be available, but the electricity infrastructure is lacking. Finance has also historically been a constraint for Kenyan business although mobile money has dramatically changed this in recent years. New developments (ongoing since 2007) have resulted in two thirds of adults in Kenya having access to mobile money (https://www.economist.com/the-economist-explains/2015/03/02/why-does-kenya-lead-the-world-in-mobile-money). It is my hope that this article and its contents can be used as a resource to assist both nonprofits and businesses in Kenya as they attempt to grow. Additionally, the results of this article may be of use to nonprofits aimed at funding startups as it provides a general guide to focus their efforts.
The article follows the following structure: a brief overview of the data used, general descriptive statistics including graphical representations of findings, a brief comparison between 2013 and 2018 figures, and a reprise of the findings. Additionally, this article aims to provide insights into how this information can be used wherever possible.
Data
This study uses World Bank Enterprise Survey data on 1001 domestic Kenyan businesses. Firms are separated into three categories: small, medium, and large. Small firms are comprised of 5-19 employees. Medium firms are comprised of 20-99 workers. Large firms have 100+ employees. The World Bank Enterprise Survey data excludes firms with less than 5 employees along with the informal sector. It is intended to be representative of the private sector economy excluding agriculture.
The data includes rankings for 16
different obstacles on an ordinal scale. We use the framework proposed by
Hausmann, Rodrik, and Velasco (http://citeseerx.ist.psu.edu/viewdoc/download?doi=10.1.1.61.4218&rep=rep1&type=pdf) to identify binding constraints and
classify the obstacles accordingly. Figure 17 at
the end of this article details a flowchart summarizing the HRV
framework. Table 2 in the supplemental pdf details my method of classifying the
various obstacles within the HRV framework.
Figure 1 (Hausmann, Rodrik & Velasco, 2005)

Descriptive Statistics
Figure 2 shows the proportion of Kenyan firms that identify issues as either major or very severe obstacles. From the figure it is clear that “Practices of Competitors in the Informal Sector”, “Corruption”, “Political Instability”, and “Tax Rates” comprise the most significant obstacles for firms in Kenya. “Labor Regulations”, “Inadequately Educated Workforce”, “Courts”, and “Crime, Theft, and Disorder” are not as significant. It is interesting to note that the composition of this figure is dramatically different than it was with the 2013 data. This suggests that the Kenyan business landscape is fairly dynamic across time.
Figure 2:

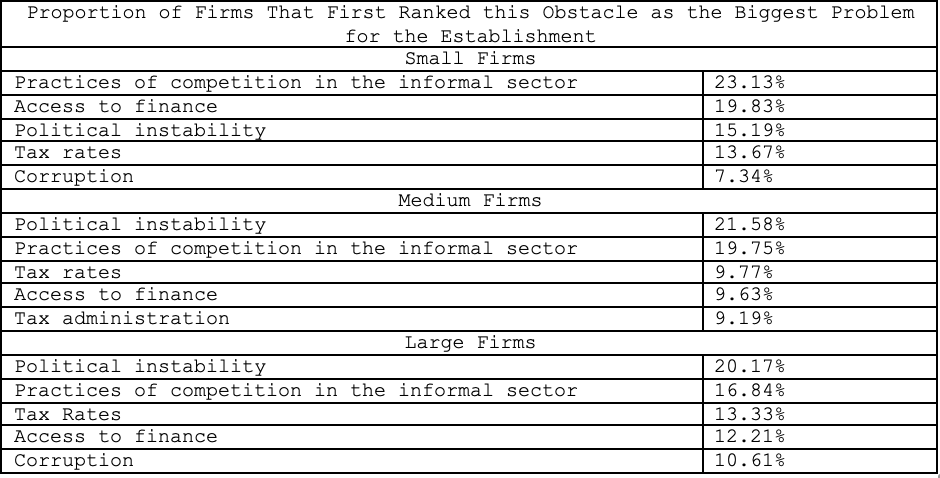
Our dataset is comprised of three different sizes of firms and it would be naïve to assume that they all face identical constraints. What constitutes a binding constraint for a small firm could very well be partially or completely alleviated by a firm’s size. Table 1 shows the breakdown of the top five most identified obstacles for firms in Kenya according to size. From this table it is clear that Practices of Competition in the Informal Sector, Corruption, Political Instability, and Tax Rates are similar obstacles for all three firm sizes while Access to Finance appears to have different impacts on firms according to their size. While there are a number of obstacles that seem fairly consistent across firm size, it still seems as if firm size has an association with constraints. Note that access to finance appears among the biggest problems for small firms while seeming to become a smaller issues as firm size increases. This could be a problem area where nonprofits could help by focusing on microloans in Kenya.It demonstrates an unmet demand for finance from smaller firms. One firm that is already focusing their efforts on microloans is Kiva Zip[1]p. Started in 2005, Kiva Zip provides loans as small as $50 dollars to businesses in Kenya’s capital city Nairobi. These loans are devoid of both interest and fees with 100% of the process being able to be conducted via a simple mobile phone. Initial results of Kiva Zip have been very promising with a 90% repayment rate and a tripling of average monthly income among recipients (UNHCR 2018). The fact that access to finance is an obstacle at all runs against the common story of Kenya leading the world in access to mobile money. Subsequent posts will attempt to reconcile the impact of mobile money and access to finance as a constraint.
Table 1:
Next, we break down each obstacle by firm size and its ranking (ordinal scale comprising of no obstacle, minor obstacle, moderate obstacle, major obstacle, and very severe obstacle). Figure 2 demonstrates the different rankings of obstacles for four of the sixteen categories. Based on the figure, it is clear that different sized firms face varying levels of obstacles. Figures 3-5 follow the same setup and a similar conclusion can be drawn.
Figure 3:
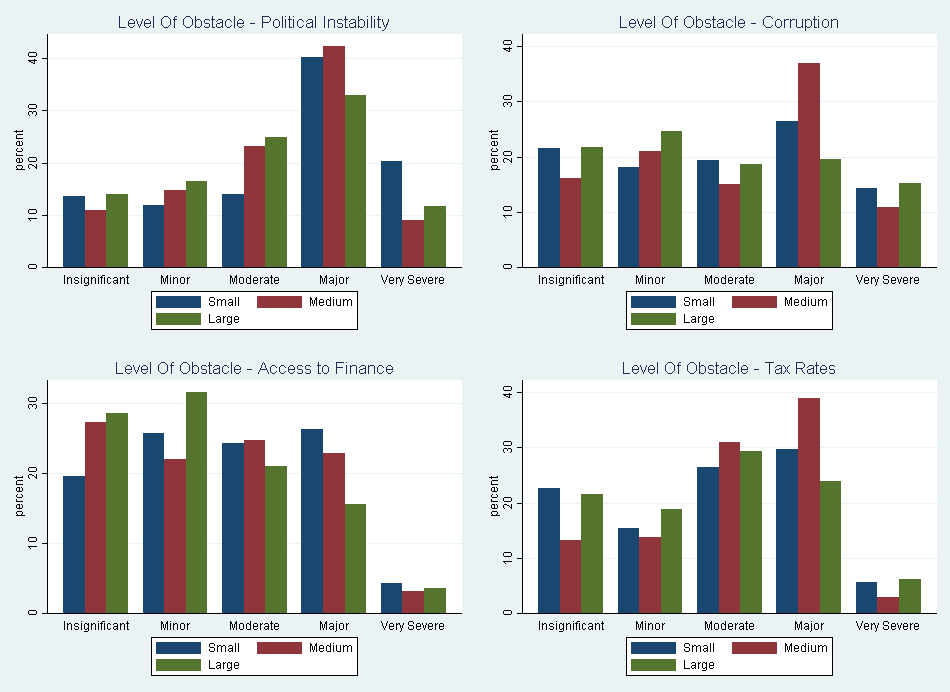
Figure 4:
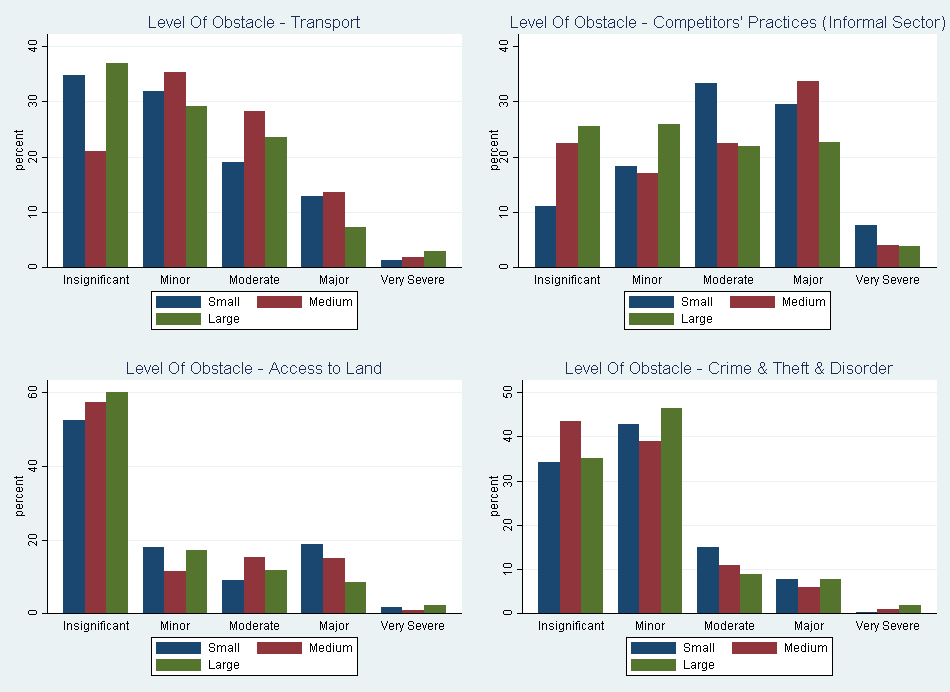
Figure 6:
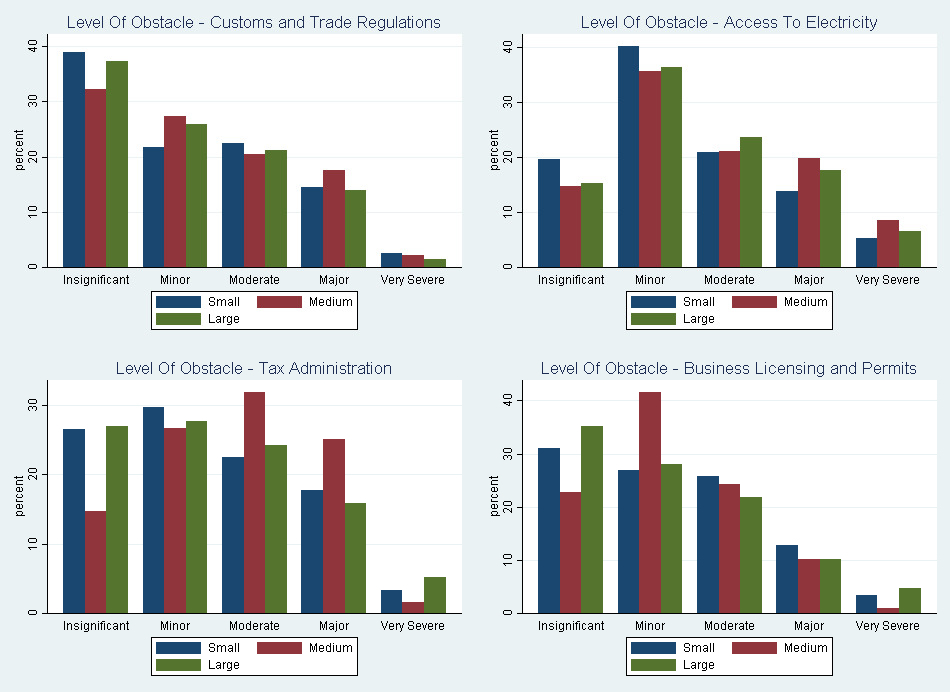
Figure 7:
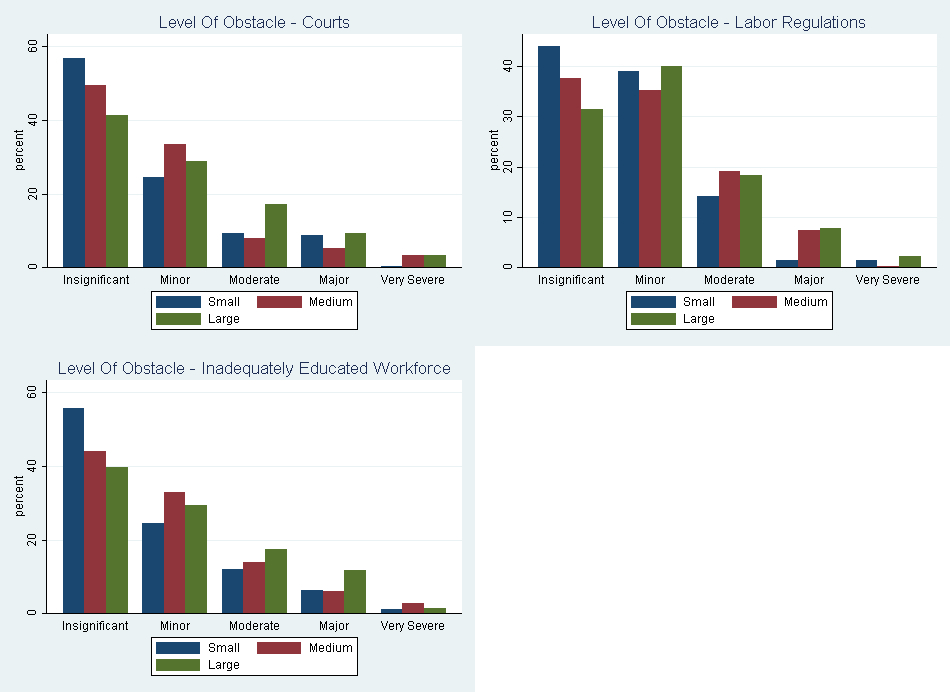
From these figures a general idea of which constraints are likely to be binding in Kenya for various firm sizes can be identified. Upon applying our model, we will be able to get a more specific idea of the extent to which each obstacle constitutes a constraint. Before moving to that step, we can get a general idea just form our descriptive analysis.
For small firms, we expect to see political instability, tax rates, corruption, practices of competitors in the informal sector, and access to land to be binding. For medium firms, we observe political instability, access to electricity, corruption, customs and trade regulations, and practices of competitors in the informal sector. Large firms consistently rank political instability, access to electricity, tax rates, customs and trade regulations, and practices of competitors in the informal sector as obstacles. This also gives us an idea of which obstacles are unlikely to be binding constraints for firms. For example, courts are rarely ranked as an obstacle and are unlikely to be an area determining growth for Kenyan firms.
Conclusion
As
the world becomes increasingly aware of the implications of statistical
analysis, the gap between developed and developing countries can become wider.
This article aims to narrow that gap by providing insight into the binding
constraints in Kenya with the intention to assist nonprofits operating there.
In future posts, an ordered probit model will be applied to the Enterprise
Survey data in an effort to apply a more rigorous method to estimating the
constraints. Additionally, a technical article detailing the use of STATA in
this series will also be published. Particular focus will be given to the use
of the cmp command and the evaluation of valid instrumental variables in the
ordered probit model. All data is courtesy of World Bank Enterprise Survey (http://www.enterprisesurveys.org/data/exploreeconomies/2013/kenya).
[1]For more information regarding Kiva Zip and their impact on the Kenyan Economy see https://blog.kiva.org/blog/kiva-zip-kenya-reaches-a-new-milestone-1000-life-changing-loans and https://www.unhcr.org/54edf4479.pdf

Comments